The report
Read the whole thing before you spend anything.
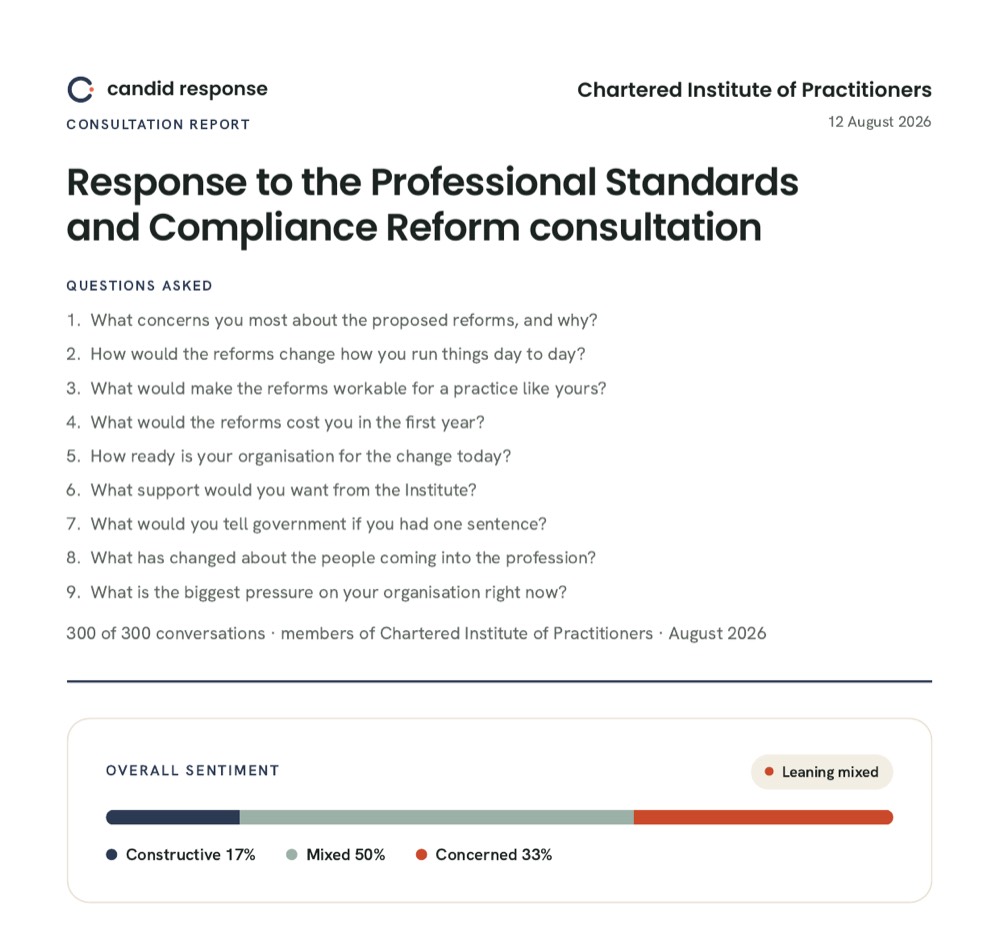
This is a real consultation report, generated by the product from 300 member conversations. Not a sample, not a teaser, not a mock-up of one. Download it, take it to your policy team, and see whether it would stand up.
No form, no email address, no call. 15 pages, 708KB.
Why the report is the product
Your submission counts as one response, however many members are behind it.
Government weights consultation responses equally. A body speaking for 40,000 members counts the same as one person writing in. So your influence does not rest on how many members you have. It rests entirely on the quality of the evidence inside the document you send.
That is why we put the report first. Everything else on this site is a claim about how we work. This is the thing you actually receive, and the only fair way to judge it is to read it.
What arrives
Three deliverables, because that is what the work actually needs.
Read enough real research tenders and the same three-part ask appears almost word for word: a publishable report, summary tables a lay reader can follow, and raw tables for anyone who wants to check your working. All three are included.
An agency will usually quote the report and price the tables and the raw data as extras. We have never understood why you would pay twice to see your own members' answers.
The report
The document above. Findings with denominators and confidence intervals, member quotes under permission, differences between groups, drafted recommendations, and a method statement. Ready to attach to a submission.
Summary tables
A plain-language page you can publish on your own site, with the caveats travelling inside the file so a number cannot be lifted away from what qualifies it.
Raw data
Response-level data so anyone can re-analyse it. It carries no identity column, because there is no identity on a response to export.
Section by section
Every part of it, and what it is for.
Real pages from the report above. Nothing here is drawn for the website.
01
Provenance, before anything else
The consultation it answers, who was consulted, when it closed, how many conversations it rests on, and the questions in the order they were asked, numbered so a department can cite one back precisely.
Why it matters. An official reading a submission decides very early whether to trust it. Most member research never states its base at all.
02
Every figure carries its denominator and its uncertainty
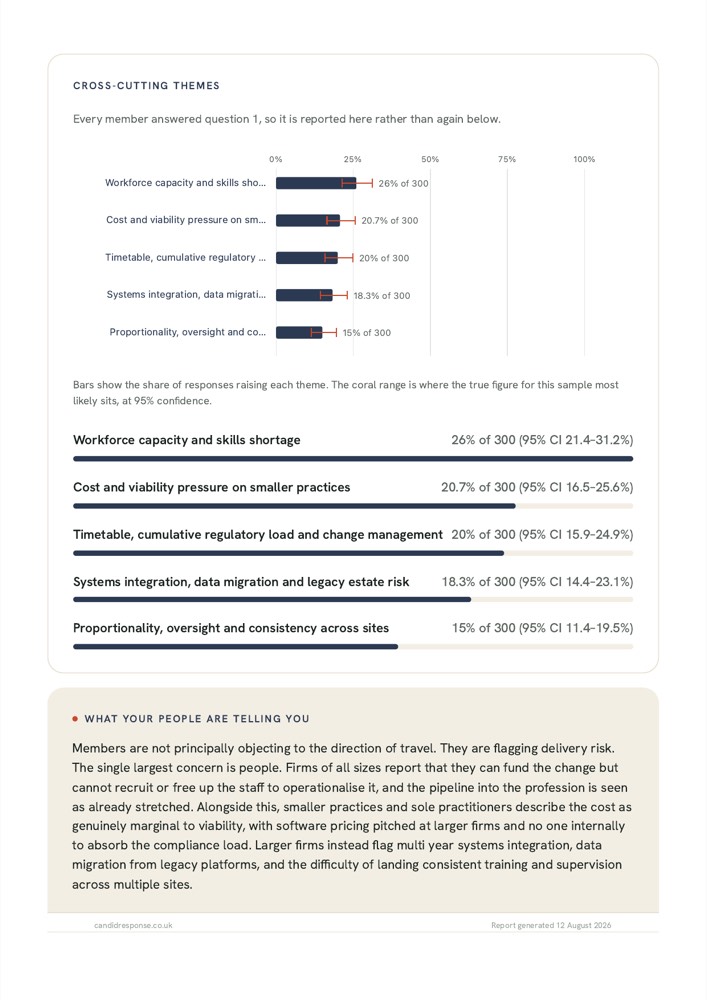
Themes are reported as "26% of 300, 95% CI 21.4 to 31.2%", with a chart that draws the interval rather than a bare bar.
Why it matters. A percentage without a base is unusable to a policy official, and it is the single most common weakness in the member research these bodies publish today.
03
Each question answered on its own terms
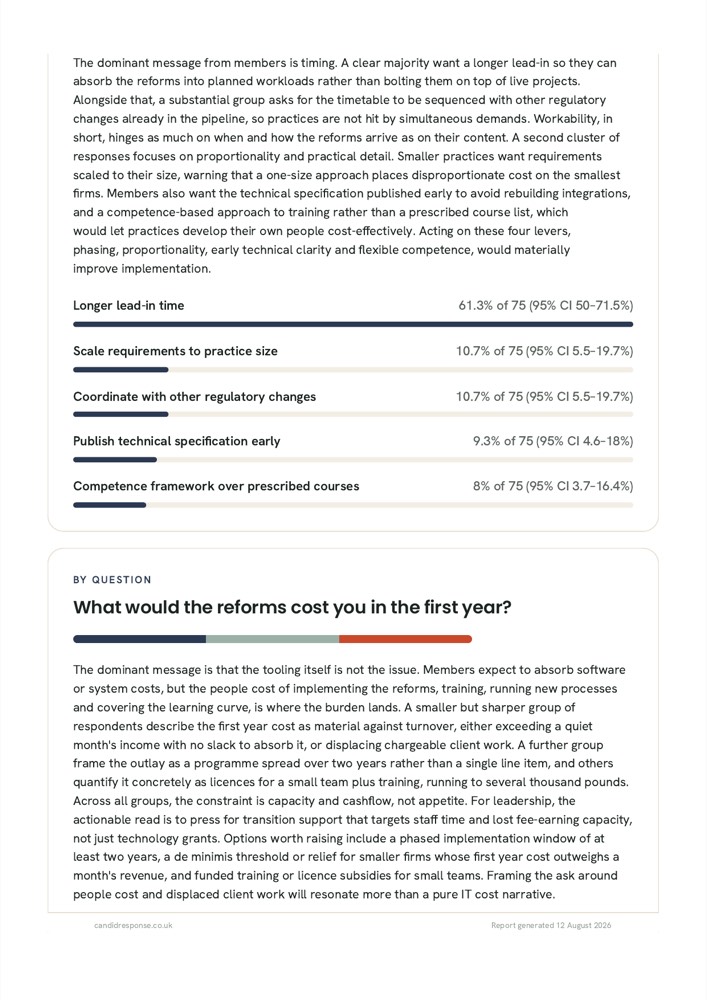
Every question gets its own analysis, sentiment and themes, reported against the number of members who were actually asked it.
A five-minute conversation holds about three questions. This consultation covered nine, because members were dealt different slices of a wider set. Each is reported honestly against its own base, never as a share of the whole membership.
Why it matters. It is how you ask twenty things without a twenty-minute interview nobody finishes.
04
Members in their own words, with their permission
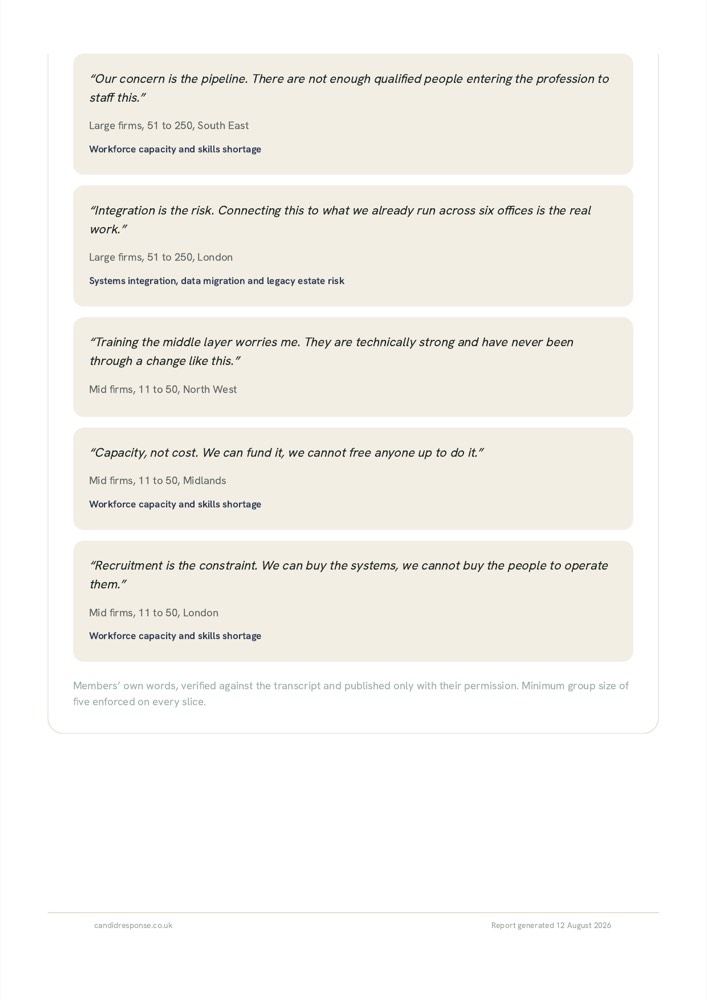
Real sentences, not paraphrases, each shown with the description that sits beside it. Every quote was checked against the transcript it came from and dropped if it could not be found there.
Each member chose, for each answer, whether to be quoted at all, anonymously, with a description, or by name. They saw the exact words and the exact description before deciding, and they can withdraw afterwards.
Why it matters. A floating anonymous quote proves nothing. A quote a named firm stands behind is evidence.
05
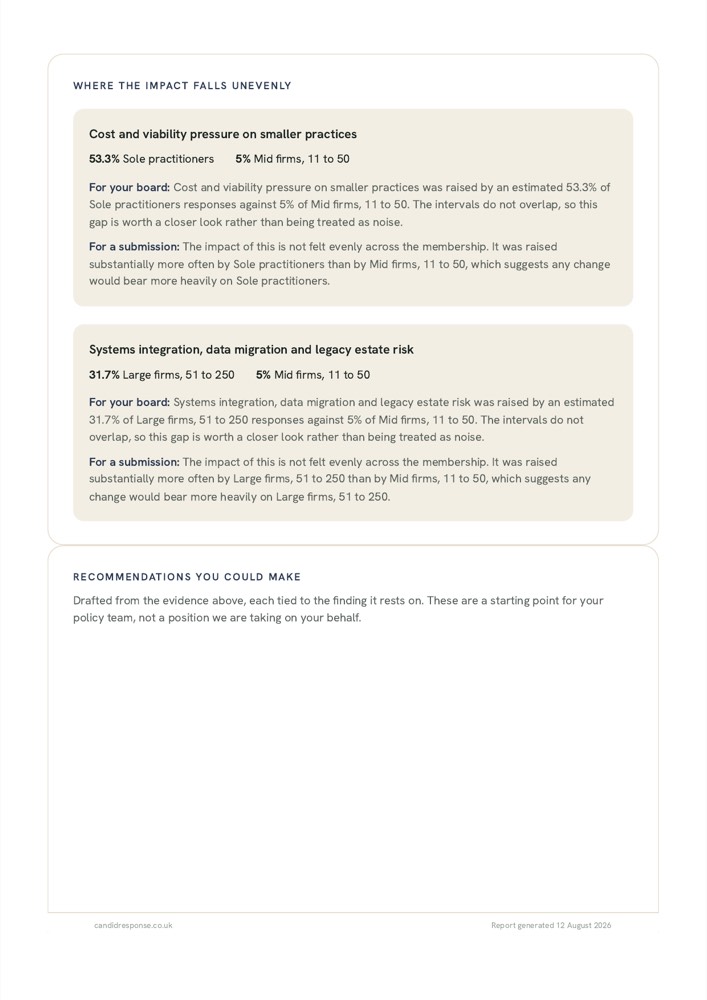
Where the impact falls unevenly, in both registers
Where two groups genuinely differ, the finding is written twice. Once bluntly for your board, and once as impact falling unevenly across the membership, which is the register real submissions use.
Why it matters. Not one published consultation response we studied ever says its members were divided. Saying it is politically costly. The finding is the same either way, so we give you both and you choose.
06
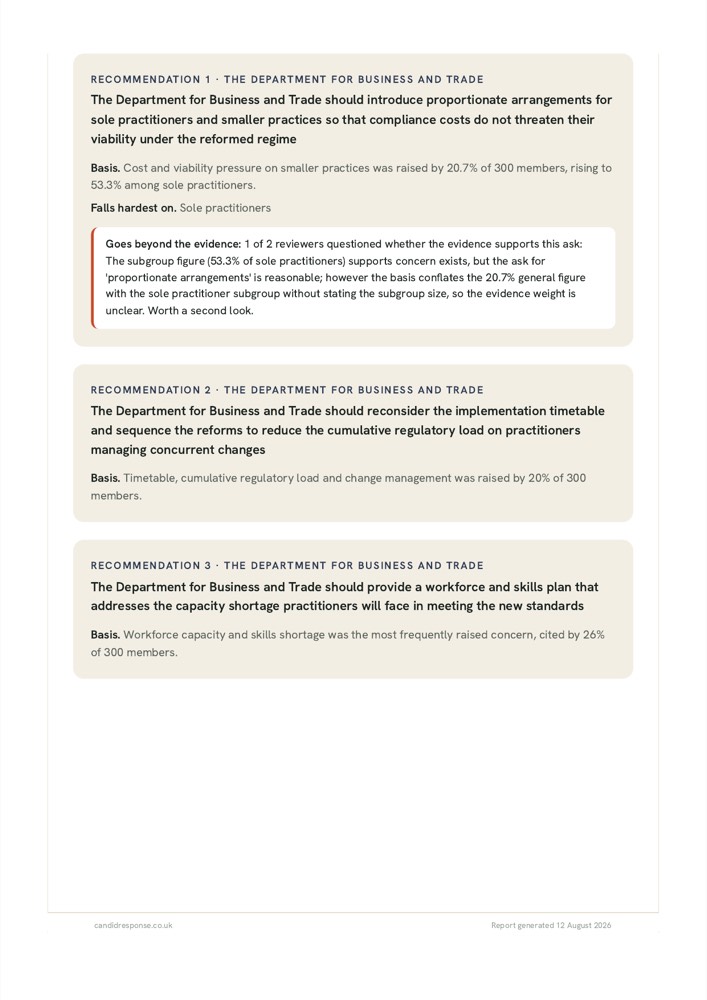
Recommendations, each tied to the finding underneath it
Drafted asks, addressed to a body checked against the GOV.UK organisation register on a stated date, each showing the evidence it rests on and which group it falls hardest on.
A second panel of models reads them looking for asks that outrun the evidence. Where it objects, the objection is printed next to the recommendation rather than quietly resolved.
Why it matters. A starting draft for your policy team, not a position we have taken on your behalf.
07
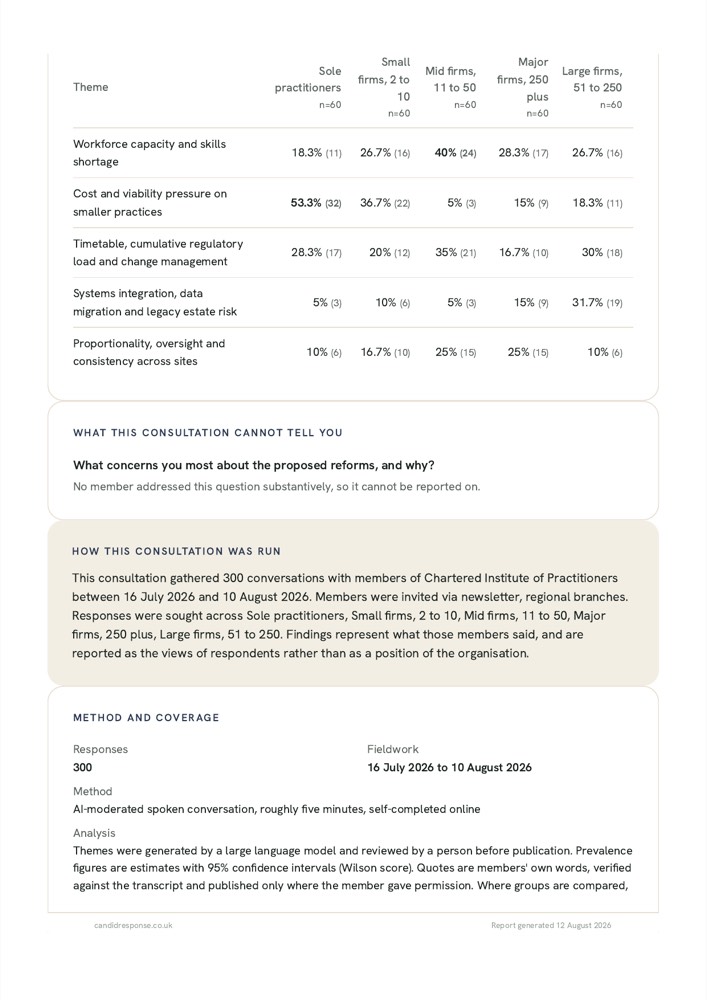
The full cross-tab, so you can check us
Every theme against every group, with the base in each cell, plus a heatmap. Not our three highlights, the whole grid.
Why it matters. Anything we chose to feature, you can go and test against the table. Highlights you cannot interrogate are marketing.
08
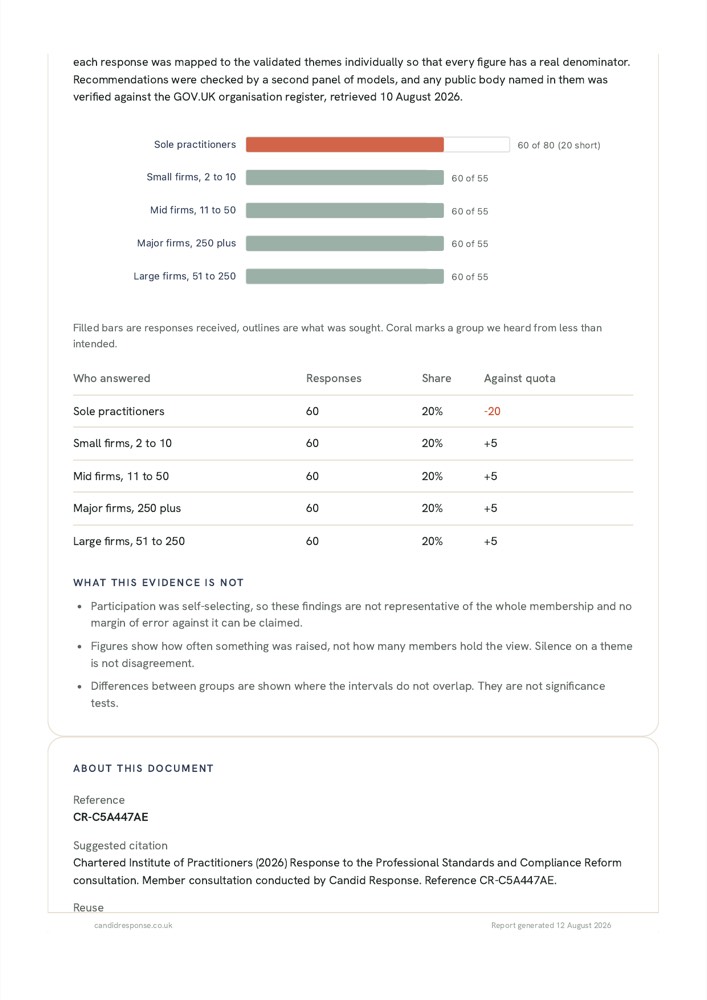
The method, and what the evidence is not
Fieldwork dates, how the conversations were run, how the analysis was done, and coverage against the quota you set, including the groups you heard from less than you wanted.
Then a short section stating plainly what this evidence cannot support: participation was self-selecting, so it is not representative of your whole membership, and prevalence of mention is not prevalence of belief.
Why it matters. A shortfall you disclose is a limitation. A shortfall someone else finds is a credibility problem.
That is the whole document. Read it in full rather than take our word for any of it.
Download the report (PDF)Before you take our word for it
The refusals are the useful half.
There is a table on the home page of things we will never say, and what we say instead. Every line in it is a claim a competitor could make and we will not, because it would not survive contact with the department you are writing to.
Measured, and honestly bounded. Running the same 88 responses through the analysis three times produced 99.2% mean agreement, with 86 of 88 mapped identically every run. That measures whether the analysis is stable, not whether it is right. Correctness needs a human-coded comparison we do not have yet, and we would rather say so than imply otherwise.
Run one, and get a report like this on your own members.
Twenty funded conversations to start, so you can see the whole thing work before you commit to anything.